
What is Market Profile Trading? Charts, Indicator, Strategy, Books, & Course
- Profile Traders
- Sep 9, 2020
- 13 min read

Updated: Oct 22, 2023
Market Profile is a technical concept with a unique charting technique developed by Peter Steidlmayer when trading at the Chicago Board of Trade (CBOT), and it was open to the public in 1985.
Market profile is a style of plotting "Price" on the Y-axis and "Time" on the X-axis, which most of the time form a bell-shaped image as the body of the profile.
It helps day traders identify Other Timeframe Participants (Big players) who have money and information power. Our job as short-term traders is to follow these big sharks, which give direction to markets.
Table of Contents

Popular Topics
What is Market Profile Trading?
Market profile assists the short-term traders in reading the current market trends as it unfolds. It considers the latest market data as it comes and provides an excellent price, time, and volume analysis to give the best of the best information about what it wants to do next.
It provides an X-ray vision of the market as Value Area represents 2/3rd of the day’s activity (or 70% in some cases), and this will give a clear picture of the current state of the market as it unfolds.
It works in all market conditions. Usually, a trading system or indicator works in certain market conditions like a trending or sideways market. There is no such restriction to Market Profile as it clearly shows the balanced and imbalanced market conditions in both directions all the time.

The marketplace is full of different players like big buyers, big sellers, scalpers, intraday traders, swing traders, and positional traders. The combined action of these players together is the main reason behind price fluctuations.

Big buyers and Big sellers will execute their plans at different price levels, and they cannot trade with each other at the same price level. Others act as a bridge between these two payers by providing liquidity, as shown in the below image.

Let's say a script is trading at 100. Big Buyers will have a plan to buy this script only below 50, and Big Sellers will have a plan to sell this script just above 150.
If we restrict the trading activity in this script only to big buyers and big sellers, the price will be stuck at 100 as both of them don't have plans to trade at this level.
If we allow other players such as scalpers, day traders, swing traders, etc., then they provide liquidity to the market. Their participation will take the price to either 150 or 50 depending on all other traders' combined efforts except the big players. If the price reaches 50, big buyers will pitch in, and if the price goes to 150, big sellers will pitch in to initiate their trades.
This interaction between big players and short-term players distributes trading volume in a bell-shaped curve, as shown in image 2.
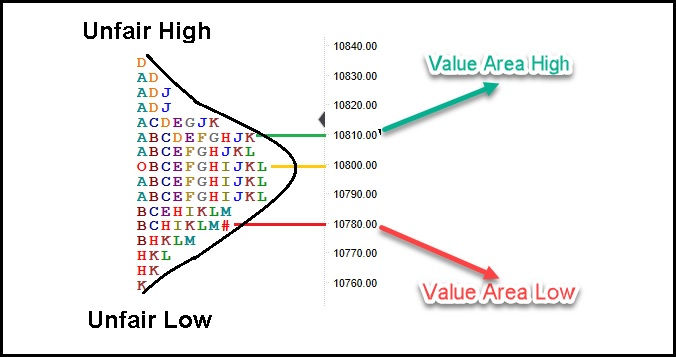
The primary purpose of any marketplace is to facilitate trades. A script's price will go up until the last buyer has bought, and there are no more buyers at a higher price, which is recognized as Unfair High.
Similarly, it moves down until the last seller has sold. There are no more sellers at a lower price, which is identified as Unfair Low.
The end of the upside auction is the beginning of the downside auction and vice-versa. Hence, we can say the marketplace facilitates trades with the "Dual Auction" process.
Once the market defines a range with an unfair high and an unfair low, it negotiates within the range to establish a "Value Area."
How to learn market profile (MP)?
Understand MP charts are different compared to candlestick charts
Study previous day MP chart and mark VAH, VAL, and POC levels
In the case of balanced open, these levels act as support & resistance
In case of imbalanced open, PDH & PDL acts as support & resistance
Free Market Profile Charts
It is effortless to plot a market profile chart using an excel sheet. First, let us understand how a #marketprofilesoftware plots the chart, then it is easy to construct in an excel sheet.
Each half an hour of the trading day is designated by a letter, which is also called Time Price Opportunity (TPO).

We denote the first 30 min range with the letter ‘A,’ the next 30 min range with the letter ‘B,’ and we continue this procedure until the last range of the market.
The above chart is of Nifty, and hence the last range is denoted with ‘M’ as the Indian markets currently trade from 9.15 am to 3.30 pm with the last session ‘M” is for only 15 minutes from 3.15 pm to 3.30 pm.
‘O’ in the first session indicates the open price level, and ‘#’ in the last session indicates the closing price level.
This charting in Market Profile is called ‘Split’ profile, and pushing these TPOs (letters) on the left side (wherever space is present) will create the ‘Un-Split’ profile, as shown below.

Point of Control (POC) is the price level in which maximum time was spent (Price Profile) or maximum trading activity (Volume Profile) occurred on any day.
In the above image, 9980 is the point of control (POC). Value Area (VA) is the 70% price range around POC. It is the fair price of the Nifty on this particular day. So range from 9958 to 9992 is the Value Area (VA) on this day.
By the end of every trading day, the market profile chart shows not only what happened on that day but also who is responsible and when it happened.
There is much software that can plot the market profile chart in the live market automatically. Traders can use any of this software or use Excel to write the MP chart manually.
To know how to plot the market profile chart on an excel sheet (Market Profile Calculator), watch this video.
How to read market profile (MP) charts?
POC - Point of Control indicates maximum trading activity
VA - 70% price range around POC (VAH & VAL are high & low of VA)
O - Open
# - Close
PDH - Previous Day High
PDL - Previous Day Low
We do share live intraday options trades (based on market profile and open interest) on our Telegram Channel, to know more, you can join here - Traders Group Run by Indrazith
Market Profile – An Indicator or Not?
Most of the technical indicators which are available in the stock market are derived using different types of calculations from the price - Open, Close, High, Low, and Volume.
All these indicators assist traders with Buy/Sell decisions either directly or indirectly.
For example, an RSI reading of 30 indicates an Oversold situation and advises the traders to look for a long trade.
Similarly, a short-term MA (5 DMA) crossover above the long-term MA (50 DMA) indicates the end of the downtrend and advice traders to plan a long trade.
Whereas Market Profile assists the traders in reading the current market trends as it unfolds. It provides a 3-Dimensional view as compared to the traditional 2D view in Candlesticks charts. The prominent feature of the market profile is it enforces the traders to study the market dynamics and doesn’t generate any buy or selling decisions.
Hence, Market Profile plays a different role as compared to any traditional indicators in the market.
Does a Market Profile Work in Intraday Trading?
Market profile helps short-term traders identify the activities of Big players who have money and information power.
Many traders don’t understand the importance of TIME on both the price and opportunity at the day trade level. In day trading, the opportunity is inversely proportional to time.
An attractive opportunity to buy below value or sell above value will not last long as big players act very quickly, and their position size pushes the price very soon to the other side.
Another simple example of the importance of time is a price that is not accepted over time is a sign of rejection of that price level.
In a candlestick chart, Price variations are plotted on the “Y” axis against the Time “X” axis. In this type of chart, time remains constant throughout the price variations, which means we are not using the time parameter effectively.
If most technical charts consider only Price and Volume with a fixed time point (thereby ignoring the effect of time).
Market profile considers Price and Volume, along with TIME, which helps to identify good trade opportunities in day trading.

The above image shows the same unit of TIME is allocated for both 42 points move and 120 points move. This indicates we are not using the time parameter effectively.
Now, look at the same day in a market profile chart in the below image.

It is evident that the time has been allocated effectively based on the price variations. It gives a 3D view of the price auction with respect to time. Also, you can see the Value Area, unfair high, unfair low, and even point of control (POC).
As an intraday trader, one should try to identify the activities of big players who have money and information power. Our job as intraday traders is to follow these big sharks who give direction to markets.
'Market Profile' is a simple technique that helps you to identify the movements of these big players.
Hence, there is no such thing as a market profile that does or does not work. It is only a trading concept that provides an extra edge for day traders and short-term traders.
If you apply it properly, you make money, and if you don’t apply it the right way, then you lose money.
We do share live intraday options trades (based on market profile and open interest) on our Telegram Channel, to know more, you can join here - Traders Group Run by Indrazith
Day Structures in Market Profile
If you think of all the big players as a single personality, it is possible to estimate their activity based on their convictions.
Market Profile, with its unique features, identifies a few readable patterns in the daily time frame based on the level of participation of big players.
IB Range is the first one-hour range in the market created by retail traders (most of the time).
Retail traders can only provide market depth and liquidity, but they fail to give magnitude and direction to the price.
Based on the IB range and price variation around the IB range, Market Profile identifies 6 important day structures:
Normal Day
Normal Variation Day
Trend Day
Double Distribution Day
Non-Trend Day
Neutral Day
1 - Normal Day

Most of the price auction will be inside the IB Range due to a 2-sided price auction. In the above image, all TPOs auctioned for the entire day happen within the initial balance i.e. ‘A’ & ‘B’ range.
Normal days are characterized by a very wide initial balance range and the whole day, the price auction happens within the IB Range.
IB range is subjective for every stock or index to declare a few points as wide IB or small IB (as every script/index comes with a different price level and price range). As a thumb rule, one can take the average of the last ten day’s price range (Low to high), and if the IB exceeds that average range, then it can be considered a wide IB. For example, if Nifty last 10 days' average daily range is 100 points, any initial balance range above this average of 100 points can be considered as a wide IB range.
2 - Normal Variation Day

As the name suggests, it is similar to a Normal Day, but with a slight variation in it. The price can move outside of IB in any one direction (either up or down). This movement of price outside of the IB range (range extension) generally will be equal to the length of the price range in the IB. For example, if the IB range is 50 points, the price will move outside of IB approximately by 50 points.
IB range will be a moderate range which is comparatively smaller than the normal day IB range. About 50-60% of ten day daily average range of the asset class. For example, if the average 10 days daily range in nifty is 100 points, the moderate range is 50-60% of 100, which is 50-60 points.
It is because OTFs don’t participate at open, they will watch the market for some time, and then they enter after the formation of the IB range to create a range extension on any one side of the IB.
In the above image, ‘C’ fails to create a range extension on the upside, but later OTFs enter in ‘D’ print, and their action results in a range extension on the upside.
3 - Trend Day

On Trend Day, OTF Participants will act from the very beginning of the day right from the Open. We can see two types of Trend Day – Bullish Trend Day and Bearish Trend Day
In a Bullish Trend Day (above example), OTF buyers will be active from the beginning. Hence price moves on the upside and generally will not come back to the open price level (or IB low)
Similarly, on a Bearish Trend Day, OTF sellers will be active from the beginning. The price moves only on the downside and generally will not come back to the open price level (or IB high)
Usually, trend days will have a small IB range (30-35% of the last ten days' daily average range).
The profile will be very thin during a trend day with only 4-5 prints at most of the price level.
Smart money (OTF) is in control throughout the day with price auction just in one direction with high conviction.
Usually, make an Open-Low or Open-High formation and swiftly moves in one direction only.
4 - Double Distribution Day

It is another variation of a trend day. As compared to Trend Day, on Double Distribution day, OTFs are not very active right from the beginning.
Similar to a trend day, this day will also have a small IB range formation
Usually, OTFs will gain confidence after IB range formation (after ‘D’ or ‘E’ print formation), and they will drive the price in one direction
The big move happens with some pause, and generally, two (rarely three) distributions of the price will occur in a DD day, as shown in the above image. These two distributions are usually separated by a few single prints (or sometimes by very few double prints)
DD day does not display the steady confidence of OTF participants right from the open, as shown in a Trend Day, but it presents aggressive participation of OTF participants after IB range formation, generally after the D or E session.
5 - Non Trend Day

It is similar to a Normal Day but with a small or medium IB range. A lack of directional conviction characterizes this day.
This day type usually occurs before a particular event like RBI Qtr Results, Fed meeting, corporate action, or election results. Because the market (or OTFs) is waiting for some fundamental information to come, and they want to react only after that information is out.
Sometimes it shows a small IB, and traders might get confused with a trending day. However, the absence of extremes and also the knowledge of ‘Open-Types’ will prevent the traders from being wrong.
6 - Neutral Day

On a Neutral Day, the IB range will be moderate, and the price will break the IB range on both the sides
The market shows a lack of direction clarity on a Neutral Day as both OTF buyers and OTF sellers fight with each other to gain control of the price. In other words, both OTF buyer and OTF seller are active because if one is active, it would have created an imbalance situation resulting in a Trend Day or a Normal Variation Day.

Market Profile Trading Strategy
Traders can develop many trading strategies using different Market Profile concepts.
On 100 trading days in any market (be it currency, commodity, or equity), over 70-75 days will be Normal Variation (NV) and Trend Day.
NV day and Trend day are the trading days in which the price extends, breaking either the low or high of the IB range.
So, if a trader just deploys ORB Technique to take advantage of this feature, he will be on the profitable side most of the time (75% ignoring whipsaws and self-mistakes).
ORB Strategy is developed by TOBY CRABLE, and it is one of the most famous trading strategies among intraday traders.
It is based on the concept that “Amateurs open the market and professionals close the market.”

Select Nifty, Banknifty, or any major stock in Nifty-50.
Wait for 1-hour range (IB Range) completion.
If the price breaks on the upside, opt for a long trade above the high of the 1-hour opening range, keeping a stop-loss a little below the breakout candle (or IB High).
Some traders prefer to trail their stop-loss along with the price using a moving average (MA), PSAR, ATR, or Bollinger Band indicators.
However, some traders prefer to hold the trade with an initial stop-loss till the market completion to avoid closing the trades due to whipsaws.

The above image shows an example of an opening range breakout trade in Bank nifty.
First, it formed a 1-hour range. Then the price consolidated within this range for some time. In the last few sessions, the price broke above the high of the 1-hour range and displayed a good move on the upside.
This strategy has offered around 50% accuracy and a risk-reward of 1:1.8 for Bank nifty in the last 10 years. Hence, this is a pretty good system to deploy in intraday trading.
(Caution - Please do your own backtesting, and deploy only if you find good results)
We do share live intraday options trades (based on market profile and open interest) on our Telegram Channel, to know more, you can join here - Traders Group Run by Indrazith
Market Profile Books
Below is a list of good books that are helpful for learning Market Profile in detail:
Mind Markets and Money by Indrazith Shantharaj and CA Rudramurthy
CBOT Market Profile Handbook
(Some are paid links)
Market Profile Software - Gocharting or Tradingview?
If you are looking for free online market profile NSE charts, then you can check with gocharting.com
Market Profile Software is helpful for committed intraday traders. There are many resources to get market profile software. However, BellTpo is one of the best software to view market profile charts.
Market profile charts in Tradingview
Unfortunately, Tradingview doesn't support Market Profile charts yet.
Market profile charts zerodha
Unfortunately, Market Profile charts are not yet available with Zerodha. As of now, Zerodha supports only Volume Profile charts.
Market Profile vs. Volume Profile
In a Market Profile (price profile chart), total TPO (letters) counts will be used to calculate the Value Area of the Day. Price profile is also referred to as TPO profile.
Volume Profile is based on the turnover (Quantity X Price). POC determined through the volume profile will be the same as the Volume-weighted average price (VWAP).
The three essential components of the auction process are:
Price—it advertises all the opportunities.
Time—it regulates all the opportunities.
Volume—it measures the success or failure of all the advertised opportunities.
Volume is essential, as 80% of the trading volume is given by 20% of the big players. However, time also plays a crucial role because a price not accepted over time is a sign of rejection of that price level.

A few traders use only the price profile, and they ignore the volume profile, but some traders use only the volume profile.
As you know, Price, Time, and Volume are the three critical elements in trading. Market Profile gives importance to time traded at a particular price that is considered in the price profile compared to volume profile, which considers volume traded at a specific price.
Market Profile Course
Intraday Trading is the most debated and misunderstood topic in the trading community.
Every day we hear many scams related to intraday trading, which promises huge returns.
Unfortunately, many beginners who believe in ‘get-rich-quick’ schemes fall for it and lose their hard-earned money.
However, many successful intraday traders make their living just by doing intraday trading.
Let us say you have got an opportunity to drive a Formula-1 car.
What do you say?
‘Formula-1 car does not work!’ or
‘I do not know how to drive a Formula-1 car.’
If you are sensible, you pick the second statement. Isn’t it?
The same explanation goes for intraday trading.
There is no point in debating whether intraday trading is profitable or not.
It is only a type of trading in which you have to close the trade on the same day. If you are right, you make money, and if you are wrong, you lose money!
Do you want to learn more about Market Profile and how to use it in Intraday Trading?
Then you can try the Market Profile Intraday Trading course.
(It also covers Options Selling strategies along with hedging)

Get the Mini Trading Guide
A 5-day email course with amazing tips on trading, different trading instruments, and how to finalize a trading system. Get a best-selling eBook and online course by signing up for free.


Market Profile Trading is explained in a practical way, especially the focus on price vs time and the idea of following larger “participants” through the day structure. I also appreciated the balance between theory and actionable intraday questions—like whether it truly works when conditions change quickly. If you’re building workflows for handling data tables for analysis, TableConvert would be a handy option when you need to convert excel to json for charting or research.
Thank you for sharing this valuable insights. It really helped me a lot. Meanwhile if your interested in options trading you can our page - Options trading in India, traded mainly on NSE and BSE, options offer flexibility, leverage, and limited risk for buyers. It's a popular strategy among traders seeking short-term gains or protection against market volatility.
Market Profile is all about understanding patterns and acting on probabilities — principles that mirror the world of sports betting and casino games. Just as traders analyze volume distributions to predict market moves, seasoned bettors study odds and patterns. At elonbet casino that kind of insight pays off. With real-time data, betting tools, and live updates, it becomes more than luck — it becomes strategy.
I'm delighted with my experience on the Baji Live Casino India website https://bajibet.in/app/ . The comprehensive information and reviews gave me confidence in the platform. The added convenience of being able to download their betting and gambling app for both Android and iOS directly from the site showcases their commitment to user satisfaction.
Thank you for providing such a comprehensive guide on Market Profile Trading, covering charts, indicators, strategies, books, and courses! Your insights are incredibly valuable for traders looking to master this trading approach. Keep up the excellent work! TradeWatch360