
What is Price Action Trading? - Strategy, Books, Course, PDF, and System
- Profile Traders
- Oct 4, 2020
- 9 min read

Updated: Jul 27, 2022
(Listen this article in audio format)
(voiced by - Sharmila R Udupa)
Did you know that most of the technical indicators are derived from the price? Besides, price action trading plays a crucial role in all types of trading? Be it scalping, intraday trading, breakout trading, or positional trading.
This article will cover all the aspects of price action trading, starting from the basic definition to the application part, which is beneficial to forex, commodity, equity, and derivatives traders.

Contents
What is Price Action?
'Price Action' means price fluctuations of a script in the given market.
On any trading day, from open to close, the price keeps on changing. This variation is nothing but price action (market action).
What is Price Action Trading?
It is a trading technique in which traders make trading decisions by looking at the naked price chart
Price Action traders don't use any technical indicators
They look at only 'Price' and 'Volume' information on the chart
PA is a powerful trading technique
The famous trader John Murphy has mentioned in his book "Technical Analysis of the Financial Markets", that technical analysis is the study of market action using charts, aiming to forecast future price movements.
He also suggests the best way to learn about the stock market is using only two components - 1) Price and 2) Volume.
Why Price Action Trading is the Best?
Price dictates indicators and not vice-versa.
The price contains all the information.
Even after knowing fundamental knowledge of stock, traders have to trade with the price.
Indicators Ignore Human Psychology.
Indicators Overcomplicate Trading.
Popular Topics
What Does Price Action Mean in Trading?
Have you ever taken a chart in Tradingview or Zerodha and:
Removed all of the Moving Average (MA), Bollinger Band (BB), PSAR indicators?
Removed all the underlying indicators like RSI, Stochastics, MACD, ADX?
Do you think you would be able to trade? Some traders may ask how to trade in the stock market then?
It might look impossible, but don’t forget most of the indicators derive their existence from one thing – ‘PRICE.’
A fluctuation in the price will also bring variations in those indicators. Isn’t it?
Then which is better to study? The PRICE, or Indicators? one can think for some time.
The three essential components in share market trading are (in the same order):
Price—it advertises all the opportunities.
Time—it regulates all the opportunities.
Volume—it measures the success or failure of all the advertised opportunities.
Volume is essential as 80% of the trading volume is given by 20% of the big players.
Price Action Indicator
Technical Analysis in the stock market starts with the analysis of ‘Price Action’ as the first step. Then it begins with many technical indicators as a supportive element to the price action.
As the name suggests, any ‘Indicator’ gives the indication. But they don’t dictate the price. In fact, any changes in the price will cause variations in most of the indicators.
It is widespread to hear many misconceptions about indicators in the stock market community.
For example, many traders say, ‘RSI is reached 30, which is an oversold zone, and hence the price will bounce back now’. But the price doesn’t know (or care) whether RSI has reached 30 or not, and it just does what it has to do! If the price shows more fall, then the RSI value will also fall (but relatively slow below 30).
It doesn't matter whether a trader uses a bar chart, line chart, point & figure chart, or Heiken-Ashi chart. It is always better to give top priority to price action. In fact, ‘Price’ is the topmost Price Action Indicator in the world of trading!

How to Learn Price Action Trading?
Remove all the indicators from the chart
Draw support & resistance lines
Observe the price behavior near support or resistance
Plan a long trade if the price fails to break the support
Plan a short trade if the price fails to break resistance
Trial your stop-loss
Price Action Trading vs Indicator Trading
In the trading world, the debate between 'Price Action Trading' vs 'Indicator Trading' is old as Trading itself!
Below are the 4 important factors which highlight the importance of price action trading over indicator-based trading:
Indicators Ignore Human Psychology
Indicators Don't Dictate the Price
Indicators are lagging in Nature
Indicators Overcomplicate Trading
Watch the video to know more.
What does a candlestick chart show?
The price is represented in many forms- line chart, bar chart, or candlestick chart.
But candlesticks charts are the most appealing and powerful representation of the price. Hence we dig a little deeper with candlestick charts.

The candlestick chart reveals open, close, high, and low levels in a user-defined time.
If a user selects a daily chart of a stock, then the above-displayed candles represent a full day's worth of trading.
The low and high price levels indicate the highest price and lowest price made on the trading day
In a bullish candle, buyers have won the battle because the closing price is higher than the opening price.
In a bearish candle, sellers have won the battle because the closing price is lower than the opening price.
It is the primary way to analyze the price using these candlesticks. There are 6 powerful candlestick patterns that often occur in all the markets and in all the timeframes.
Before we look at them, let's first look at where they work best.
Some traders also use chart patterns to plan their trades. Some of the popular patterns are:
Cup and Handle
Double top and Double bottom
Ascending Triangle
Inverse Head and Shoulder
Symmetrical Triangle
Channel Pattern
Flag Pattern
Price Action Forex Trading
As price action trading involves the analysis of price and volume (predominantly price), it can be used in all financial markets. It includes the forex, commodity, bonds, derivatives, and equity market.
However, the forex market has extra advantages as compared to other markets, such as:
It is the largest financial market in the world, so no liquidity issues
It will be open 24 hours a day, five days every week
Forex brokers offer good leverage.
The 6 Most Powerful Candlestick Price Action Patterns
We have millions of candlestick patterns. Studying all of them is foolish because it’s difficult to understand all of them and difficult to implement in the live market.
We need to pick them based on the below parameters:
Impact
Repeated occurrence
If any candlestick formation has less impact, then it is not useful.
Similarly, if there is a powerful candlestick formation, but if it doesn’t occur very often, again it’s of no use.
Based on these parameters, I have shortlisted 3 candlestick formations:
Engulfing - Bullish Engulfing and Bearish Engulfing
Harami - Bullish Harami, Bearish Harami
Hammer/Hangman - Hammer comes in an downtrend, whereas, Hangman comes in a uptrend
These candlestick patterns help swing traders, trend traders, and even day traders as well.

Engulfing Pattern
Engulfing candles tend to signal a reversal of the current trend/swing in the market. This specific pattern involves two candles, with the latter candle ‘engulfing’ the entire body of the candle before it.
The engulfing candle can be bullish or bearish depending on where it forms in relation to the existing trend. Hence, we have two types of Engulfing:
Bullish Engulfing
Bearish Engulfing
Bullish Engulfing

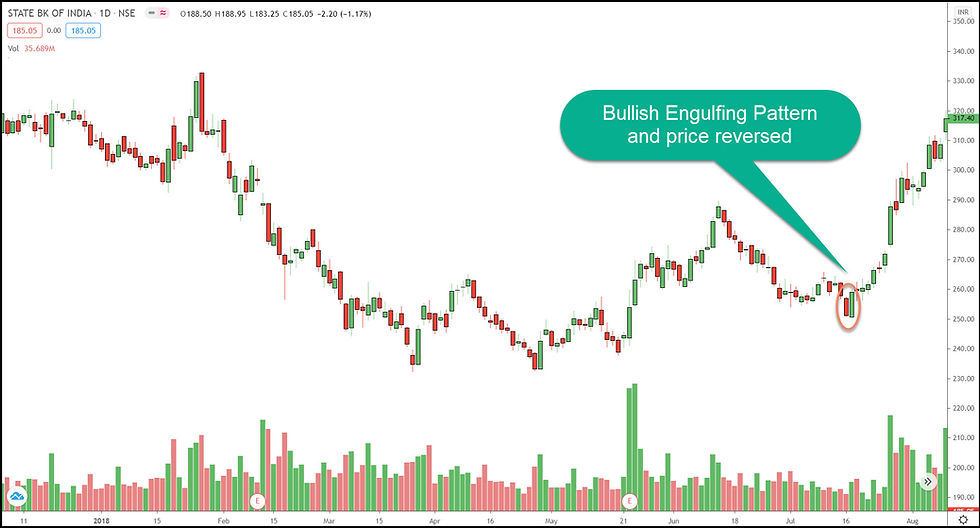
If you look at the above image, the price showed a Bullish Engulfing pattern.
Bearish Engulfing


If you look at the above image, the price showed a Bearish Engulfing pattern in Nifty.
Harami Pattern
Similar to Engulfing, we have two harami patterns:
Bullish Harami
Bearish Harami
The word ‘Harami’ means a pregnant lady in Japan.

Below are the examples for Bullish Harami and Bearish Harami:


Hammer and Hanging man Patterns
These are the third most powerful patterns.

The below charts are some examples of Hammer and Hangman patterns:


The above images show a Hammer and Hangman pattern at support and resistance levels, respectively.
These are the 6 candlestick patterns that are powerful and frequently occur in all the timeframes.
A word of caution - Please don’t use these patterns blindly. You should use these patterns as a confirmation from the price at crucial price levels i.e. support and resistance levels.

Price Action Trading Strategies/System
Two things are very crucial to get mastery of the price action trading system:
1. Support & Resistance levels Identification
2. Price Acceptance or Rejection at support-resistance levels
Support and Resistance Levels Identification
There are many ways to arrive at support and resistance levels.
However, drawing trend lines is the simplest and most effective way of identifying support and resistance levels.
A Trend Line is a straight line drawn on a chart by connecting two or more price peaks, which reveals the trend of the script, support, and resistance points, and allows to spot any excellent trade opportunities.


Price Acceptance or Rejection at Support and Resistance Levels
After knowing the support and resistance levels, it's essential to know whether the price will respect that level or not.
In the "Market Profile" world, it's called 'Price Acceptance' and 'Price Rejection.'
The understanding of "Acceptance" and "Rejection" of the price is significant to initiate a good trade.
There are 2 ways to identify price acceptance or rejection:
Using the 6 candlestick pattern
Through raw price action
Using the candlestick Pattern
Case-1:

The above image shows an example of price rejection through a bullish engulfing pattern.
There is a good support line, and the price displayed a bullish engulfing pattern exactly at the support line.
One can plan 'Long' trade above the engulfing candle's high, keeping a stop-loss below the engulfing candle's low.
Either one can trail the stop-loss as the price advances on the upside, or they can book the profits at any significant resistance level upside.
Case-2:

The above image shows an example of price rejection through bullish harami and hammer candlestick patterns.
There is a good support trend line, and the price displayed these two bullish candlestick patterns exactly at the support line.
Hence, one can plan a 'Long' trade above the harami/hammer candle's high, keeping a stop-loss below the same candle's low.
Either one can trail the stop-loss as the price advances on the upside, or they can book the profits at any significant resistance level upside.
Case-3:

The above image shows an example of price rejection through a bearish engulfing candlestick pattern.
There is a good resistance trend line, and the price displayed a bearish engulfing candlestick pattern exactly at the resistance line.
Hence, if you have a long position, you can exit here or one can plan a 'short' trade below the engulfing candle's low, keeping a stop-loss above the same candle high.
Either one can trail the stop-loss as the price falls on the downside, or they can book the profits at any significant support level downside.
Through Raw Price Action
Once you gain some knowledge and experience, anyone will make out this price acceptance or rejection just by looking at the raw price action.
Case-1:

The above image shows an example of price rejection through raw price action.
The price has broken the support trend line, but it denied staying below and bounced back very strongly.
It is a clear example of Price Rejection. This is good for bulls (but not for bears).
Hence, one can plan a 'Long' trade above a bouncing candle's high, keeping a stop-loss below the same candle low.
Either one can trail the stop-loss as the price advances on the upside, or they can book the profits at any significant resistance level upside.
Case-2:

The above image shows an example of price rejection through raw price action.
The price has traded above the resistance trend line, but it denied staying above and displayed a strong selling wick.
It is a clear example of Price Rejection. This is good for bears (but not for bulls).
Hence, one can plan a 'Short' trade below the rejection candle, keeping a stop-loss above the same candle high.
Case-3:

If you look at the above image, there is a clear resistance trend line.
Besides, the price also is shown clear acceptance (also breakout) from the resistance levels.
So, one can plan a long trade above the high of the breakout candle, keeping a stop-loss below the low of the breakout (acceptance) candle.
Either the trail stop-loss concept can be applied or can be exited at predetermined levels.
When learning price action trading, beginners can opt for the 'Candlestick Pattern' approach in the beginning. Once they get some clarity, they can switch to the advanced version which is through raw price action.
Price Action Trading Course
Price action trading is a powerful concept and is the foundation for numerous strategies used by many traders.
The famous price action trader Nial Fuller explains the importance of price action trading in just one statement, "I was looking at everything except the most important thing; pure price action."
To get mastery in price action trading, one should learn to arrive at the best support and resistance levels.
Besides, he should be able to conclude whether the price is showing "acceptance" or "rejection" at the support/resistance levels.
With time, you learn more about price action trading. The more charts you see, your trading skill continues to grow.
But to get to that point, you first need to start. And the best place to start is usually right where you are!
If you would like to learn more about Price Action Trading, check out my latest course, The Price Action Trading Strategy Guide

Price Action Trading Books
There are many books on price trading topics. Traders develop their own unique approach to price action trading.
However, Laurentiu Damir takes an in-depth dive into analyzing the price patterns on charts in a unique way in his book “Price Action Breakdown.” I have not seen a few concepts that he describes anywhere else.
This book helps to learn price action trading, learn to trade the market, and explain different price action setups.
After reading the book, one thing will be clear that you will not look at the chart in the same way you had before!
Price Action Trading Course
If you are interested to learn stock market trading online and in-depth dimensions of price action trading strategies, then register for the below price action trading course.

Are you interested to learn an options trading technique to earn 5% returns every month?
Do you want to know how to deploy different options techniques in intraday trading?
Then dive inside the 'Option Course' to know about different intraday options trading strategies to trade in Nifty and Banknifty.


https://domaintakip.org/
https://domaintakip.org/
https://domaintakip.org/
https://domaintakip.org/
https://glasswasher.org/
https://glasswasher.org/
https://glasswasher.org/
https://glasswasher.org/
https://sewamobildijogja.id/
https://sewamobildijogja.id/
https://sewamobildijogja.id/
https://sewamobildijogja.id/
https://anandamargapy.org/
https://anandamargapy.org/
https://anandamargapy.org/
https://anandamargapy.org/
https://citysaveudc.org/
https://citysaveudc.org/
https://citysaveudc.org/
https://citysaveudc.org/