
"Secrets of Fibonacci Trading" by Frank Miller Book Review: Profile Traders
- Profile Traders
- Nov 12, 2022
- 5 min read

You must be wondering why I am losing money or not being profitable even with a back-tested system.
Well, back-tested systems work well when market dynamics remain the same. With market dynamics ever-changing, your trading system needs to be optimized.
Fibonacci techniques discussed in this book will help you be profitable and use techniques used by successful professionals.

Why Should I Even Consider Fibonacci to Trade?
Frank explains with an example of how Fibonacci numbers and levels are far better than lagging indicators.
They help you make your trading decisions in a far more efficient manner. Fibonacci levels help you look into probable prospects even before you get there.
Sure, Fibonacci levels are plotted based on previous levels, but they help you make trading decisions more efficiently.

This is what differentiates professionals from the rest. Retail traders enter when the professionals have already covered half the journey and exit late when professionals have offloaded much earlier than you.
Some basics on Fibonacci numbers and price behavior are described to better relate to the content shared in the later part of the book.
Fibonacci Retracement Levels
Frank explains how to draw Fibonacci retracement levels that will help you with your trading decisions. The explanation is backed by pictorial views of line and candlestick charts for ease of understanding.
I have included a weekly chart of Bank nifty right from the lows of March 2020. You will be amazed to see that the retracement level from the last high made in Bank nifty was at 61.8% retracement level.

How to Trade Based on Fibonacci Retracement Levels?
Though Fibonacci levels are not a buy or sell signal, they give you an edge to read the right side of the chart before it is formed. You may use your trade set up, and the Fibonacci levels give you an edge to trade based on these levels.
Professional traders use these levels to trade as they are time-tested and tend to work better than lagging indicators.
Frank shares 3 options to trade based on Fibonacci retracement levels. An example shared is of the 61.8% retracement level.
If you are willing to take a bigger risk, then you can initiate a trade when the price reaches 61.8%
Wait to see how the price reacts at this level to initiate a trade.
Conservative traders may look for a confirmation of a smaller break of recent LH on the upside.
Placing stop losses depend on one’s risk appetite or how long the target horizon is. Possible places where you place your stop loss are the lower retracement levels on an up-trend and the higher level on a down-trend.
When the price breaks the initial swing, then there is something seriously wrong, and the trend might just be changing.
Frank also explains how to use retracement levels along with trend lines and support or resistance. A combination of these two tools will increase your accuracy because you have the benefit of confirmation from these two tools.
Fibonacci Projections
Fibonacci projections are another method to identify where the next move will either stop or pause for some time. Retail traders get their entries right but fail to know when to close their trades.
Frank says unless you close your trade, you are still not profitable. Traders tend to believe the notional profit is what they are making and overlook on uncertainty in the market.
Fibonacci extension
Fibonacci expansion
Fibonacci expansion and extension are similar tools that help you identify where to take your profits. He simply explains these concepts even a layman with some basic knowledge about trading can understand.
Visuals included with the examples make it easier for the reader to relate to the concept and for better learning.

Fibonacci convergence
Frank moves on to explain the next level of the use of Fibonacci numbers and levels. He explains the use of Fibonacci convergence in finding strong support and resistance levels. If you have already learned how to plot retracement and projection levels, then plotting the convergence should not be a problem.
Frank explains that you will see a strong price action/reaction at convergence levels. This is because levels of two trends, one of the main trend and that of the secondary trend converge.
Prices tend to respect these levels, and if the trend is strong, they move further. These levels become strong support when they are broken as resistance and vice versa.
He includes images of these levels marked on a candlestick chat that lets you absorb the content and learn easily.
The game plan – Trade using Fibonacci levels
The game plan is simple. If you have learned how to plot the different types of Fibonacci tools, then making trading decisions will be a piece of cake.
It comes with constant practice and experience though. You can time your entries and exits in a far more efficient and effective manner.
Frank includes examples and candlestick charts with Fibonacci levels for a better understanding of the concept.
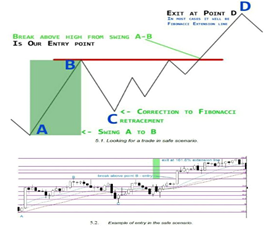
I have included a candlestick chart of Bank nifty in a daily time frame for a better understanding of a possible trade and potential profit zone.

As you can see in the above chart, the price retraced to the level marked as C, which is between A&B. A Fibonacci trader would enter a long trade when the price breaks level B. A conservative trade can opt for 0.236 as a stop loss for the long trade.
Someone who has a bigger risk appetite and can be looking for a long trade with a longer horizon can keep level C as a target as well. Potential profit targets are marked as ‘D’ ‘E’ ‘F’ ‘G’, which are various Fibonacci extension levels.
Fibonacci extension-based trades can have a win rate of up to 70% and you might see potential profits reaching 161.8% levels as well.
Techniques for Maximizing Profits.
Frank discusses various methods to maximize profits by using Fibonacci levels. He provides several examples with candlestick charts to better understand the concept. You will find it easy to plot these levels to back-test on instruments you work with to understand how trades panned out with the Fibonacci way of trading.
Several aspects of a trade and how to use it with your setup are discussed, which will help you understand how to improve your trading with Fibonacci tools.
How to look for a confirmation signal.
Where to place a stop loss.
How to use other tools like Moving averages and trend lines with Fibonacci levels.
The Williams %R as confirmation.
Range trading with Fibonacci levels.
Conclusion
Secrets of Fibonacci trading is an amazing peak into how professional traders profit from analyzing the right side of the chart. You are in for a treat if you want to move on from trading with lagging indicators and embrace Fibonacci tools.
For more insights on crucial elements in determining the market trend and movement, grab your copy of the book.
(Amazon Paid Link)
Guest Post - Written by Mr. Lal Bajaj, Bangalore
Get the Mini Trading Guide
A 5-day email course with amazing tips on trading, different trading instruments, and how to finalize a trading system. Get a best-selling eBook and online course by signing up for free.


Comments