
Fibonacci Trading Strategies - Book, PDF, and System : Profile Traders
- Profile Traders
- Oct 22, 2022
- 3 min read
Updated: Oct 22, 2023
Fibonacci trading is a strategy that uses mathematical ratios from the Fibonacci sequence to predict market movements.
The Fibonacci sequence is a simple series of numbers where each number is the sum of the previous two: 1, 1, 2, 3, 5, 8, 13, 21, 34, etc.
The Fibonacci retracement levels are horizontal lines that indicate where support and resistance might occur.
These levels are based on the Fibonacci sequence and are often used by traders to help them make decisions about their trades. The most common Fibonacci retracement levels are 23.6%, 38.2%, 50%, and 61.8%.

The most common Fibonacci ratios used in trading are 38.2%, 50%, and 61.8%.
These ratios represent the percentage retracement levels of a move in the market.
For example, if the market moves up 10% and then retraces back to the 38.2% or 50% Fibonacci level, that is considered a bullish sign. Some traders may enter into a long position at that point.
Alternatively, if the market moves down 10% and then retraces back to the 38.2% Fibonacci level, that is considered a bearish sign, and some traders may enter into a short position at that point.
The 23.6% Fibonacci retracement level is the most important of the Fibonacci levels because it is the level where most reversals happen. The 38.2% Fibonacci retracement level is the second most important level because it is where many pullbacks end.
The 50% Fibonacci retracement level is very important because it is where a lot of breakouts happen. The 61.8% Fibonacci retracement level is the last of the significant Fibonacci levels, and it is where many trend changes happen.

How to Identify The Strength of a Trend Using Fibonacci?
When a stock is in a solid uptrend, it will give a pullback of only up to 23.6% and rally upside again.

When a stock is in a medium-to-strong uptrend, it will give a pullback of only up to 38.2% and rally upside again.

But when a stock has less energy to go upside, it will give a pullback between 50 - 61.8%.

Fibonacci Trading Strategies
Strategy - 1 (for swing trading)
Entry Criteria:
Strong Uptrend + Fibonacci Retracement at 23.6% or 38.2% + Bullish Candlestick Confirmation
Enter above the confirmation candles, stop-loss below the confirmation candle, and the target is the previous high or trail stop-loss at each Fibonacci level when the price moves upside.
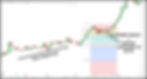
In the above image of Adani Ent, the prior trend was up.
The price gives a small pullback of only up to 38.2%.
It displays two bullish candlestick confirmations (bullish harami and hammer).
Our entry should come above the confirmation pattern and stop-loss below the confirmation pattern.
Conservative traders can exit their 50% position at the previous high and carry the remaining 50% with a trial stop-loss below each Fibonacci level.
Strategy - 2 (for Intraday Trading)
Entry Criteria:
Increase in Open Interest + Fibonacci Retracement at 23.6% or 38.2% + Candlestick Confirmation.
Open Interest is the number of contracts that have been traded that have not yet been settled. Open interest is important because it provides information on a market's liquidity and the market's direction.
If open interest increases, it suggests that more cash is coming into the market and that there is continued interest in holding positions in the contract (either bullish or bearish).

In the above image of Axis Bank futures, the open interest constantly increased, indicating the demand.
The price gives a small pullback between 23.6 - 38.2%.
It displays a bullish harami candlestick pattern once and a bullish engulfing candlestick pattern later.
Our entry should come above the confirmation pattern and stop-loss below the confirmation pattern.
We can apply the same logic to take short trades as well.
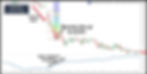
In the above image of Banknifty futures, the open interest constantly increased, indicating the demand.
The price gives a small bounce, only up to 23.6%.
It showed rejection at 23.6% fib level, and the price clearly struggled to go upside.
Our entry should come below the confirmation pattern and stop-loss above the fib 23.6% level.
Best Books Fibonacci Trading
These are just a few things that you need to know about Fibonacci trading levels.
There is much more to learn, but this should give you a better start.
If you want to learn more about Fibonacci trading levels, many resources are available online and in books.
Below are some of the good books on Fibonacci Trading:
(Both are Amazon Paid Links)
Get the Mini Trading Guide
A 5-day email course with amazing tips on trading, different trading instruments, and how to finalize a trading system. Get a best-selling eBook and online course by signing up for free.