
Fed, Debt, and S&P: Why 2025 Is Starting to Rhyme With the 2008 Crisis?
- Profile Traders
- Sep 18, 2025
- 12 min read

In 2008, the world watched in disbelief as the financial system buckled under the weight of reckless lending, soaring private debt, and collapsing confidence. What began as a housing bubble quickly spilled into a full-blown crisis that shook Wall Street and Main Street alike.
Fast forward to 2025. The names are different, the numbers are bigger, but the patterns feel hauntingly familiar. U.S. government debt has ballooned from just over $10 trillion in 2008 to more than $36 trillion in 2024 and with projections showing it could reach $38-$39 trillion by year-end if current trends continue.
The weight of trillions in private debt now collides with a Fed that keeps tightening the screws. The charts may look modern, but the story they tell echoes the same old rhythm: debt piling higher, rates tightening, and markets showing signs of strain.
This isn’t fear, it’s a reminder. When debt runs wild and warnings are ignored, the price is always painful.
👉 The lesson is clear: we need to study the past honestly, act wisely in the present, and build resilience so the future belongs not to crisis, but to opportunity.
This article is divided into three powerful sections:
Private Sector Debt vs. U.S. Federal Debt — How They’re Reshaping the Global Economy
Fed Rate Cuts and Hikes — Why They Can Be the Spark for the Next Recession
The Silent Bond Crisis — Why No One Dares to Talk About It
Reading all three sections is crucial to truly understand where we stand today — and how you can position yourself to seize massive opportunities from the storm that lies ahead.

Private Debt Slows, Public Debt Soars — The Same Recipe as 2008
The U.S private sector debt is made up of two parts:
The debt of households and non-financial businesses (known as PNFS debt) and
The debt of banks and other financial institutions (financial sector debt).
Together, these two categories show the full picture of how much the private sector owes.

This chart shows how U.S. private-sector debt, made up of both PNFS debt (households and non-financial businesses) and financial-sector debt, grew steadily from 2002 to 2007 before spiking sharply during the 2008 financial crisis.
The surge was driven by excessive borrowing across households, companies, and the financial system itself, which was fueling risky lending and securitisation. After the crisis hit, private-sector debt dropped for 3 years.
Excessive leverage, particularly in obscure or less transparent areas such as private credit poses hidden risks - Lloyd Blankfein, Former Goldman Sachs CEO
Since then, the total has resumed climbing, crossing $60 trillion by 2024, showing how debt levels have kept expanding long after the crisis.
But you need to understand what happened with the US Federal Government debt during this period (i.e. from 2008 to 2011).

This chart tracks U.S. federal total public debt from 2002 to 2024, showing a steady rise over time.
Here’s a quick question for you: Please look closely at the highlighted area around 2007–2011. Can you guess what happened to the US Federal Government Debt?
The picture becomes even clearer when we combine this surge in federal debt with the previous U.S. private-sector debt, because together they reveal how both households, businesses, and the government were pulled into the same cycle of crisis and response.

Around 2008, many big companies and banks faced severe trouble as the financial crisis unfolded, and private sector debt began to decline. Firms and households were forced to deleverage, meaning they cut back on borrowing, wrote down bad loans, and focused on survival instead of expansion.
At the same time, U.S. federal government debt spiked upward because Washington stepped in with massive bailouts and rescue programs. Companies like AIG, Citigroup, General Motors, and Chrysler were directly supported, while banks such as Bank of America and many others benefited from the broader TARP (Troubled Asset Relief Program).
The U.S. government did this not because it wanted to, but because it had to. If major banks or corporations had collapsed outright, the shockwaves would have devastated not only the U.S. economy but also the global financial system, since these institutions were deeply interconnected worldwide.
Beyond economics, there were social and political obligations too: saving jobs, protecting household savings, and preventing widespread panic. Another key reason is the principle of maintaining confidence in a credit-based economy; once trust in banks and large institutions disappears, the entire system can unravel quickly.
In short, the private sector pulled back, but the government stepped forward, transferring the burden of debt from companies onto itself in order to stabilise the cycle.

This chart shows a worrying pattern that looks very similar to what happened before the 2008 crisis. Private-sector debt, which stood at $61.989 trillion in 2024, is slowing down and is expected to reach only around $63.7 trillion in 2025 (only a 2.7% increase), showing signs of weakness. On the other hand, U.S. federal government debt keeps rising, from $36.219 trillion in 2024 to a projected $38–39 trillion in 2025 (over 6.3% increase).
This is almost a replica of the 2008 setup. Back then, private debt growth stalled and several banks collapsed — including Lehman Brothers and Washington Mutual — sparking the global recession. Today, we’ve already seen the failures of Silicon Valley Bank and Signature Bank, pointing to the same kind of stress building inside the system.
To contain the fallout, the U.S. government has once again stepped in. Instead of traditional bailouts, it is using measures that look a lot like financial-stability interventions: taking a 10% stake in Intel (announced Aug 22, 2025), introducing the Bank Term Funding Program to give banks liquidity against collateral (it was a 2023 facility providing term funding against high-quality collateral), and even revisiting bailout rules under the American Rescue Plan in cases like Yellow Corp’s pension crisis.
In simple terms, private borrowing is slowing, government debt is rising, and the U.S. is back to playing the role of stabiliser, just as it did in the run-up to the 2008 recession. The signs are showing the same story all over again.
From Peak to Plunge: The Fed’s 2008 Playbook Returns in 2025
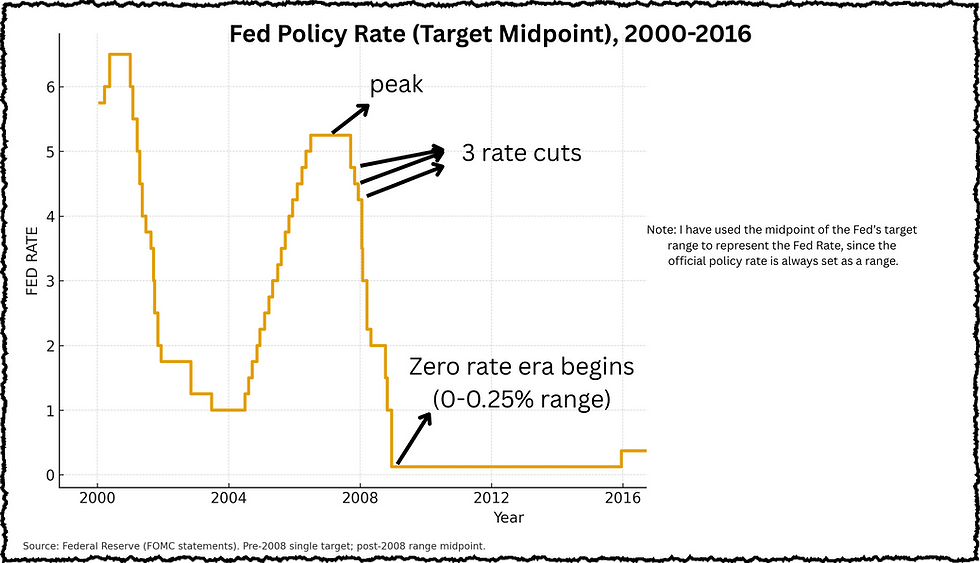
In the years leading up to the 2008 financial crisis, the U.S. Federal Reserve made three rapid interest rate cuts because the economy was showing clear signs of stress.
Housing markets were already collapsing, mortgage defaults were rising, and banks were sitting on piles of bad loans tied to subprime mortgages. As credit markets froze, liquidity in the system dried up, and lending between banks nearly came to a halt.
The Fed’s goal was simple: cut rates to inject liquidity, reduce borrowing costs, and calm financial panic. Lowering rates was meant to encourage banks to keep lending, prevent a credit crunch, and support businesses and consumers as confidence was falling apart.
However, while these cuts provided some short-term relief, they couldn’t stop the underlying crisis. By late 2008, major institutions like Lehman Brothers failed, AIG had to be bailed out, and the financial system required massive government intervention. The cuts were essentially a desperate move to soften the blow of an unfolding systemic collapse.
👉 In short: those pre-crisis cuts were the Fed’s emergency brakes, but the financial crash was already too large to avoid.

Now I have updated this chart to include the recent interest rate cut by the FED (Sep 2025), and the story almost feels like déjà vu. The Fed pushed rates to a sharp peak, almost identical to the one we saw just before the 2008 crash. And just like then, the climb didn’t last long.
From that peak, the Fed has already made three rate cuts (in second half of 2024 and a recent cut in september 2025), signalling the start of an easing cycle. Fed Chair Jerome Powell has also indicated that more cuts are likely if economic conditions continue to soften, particularly pointing to cooling labour markets and slower growth.
In the latest Fed meeting, policymakers emphasised that while inflation has come down from its highs, financial stability risks and weaker demand are becoming bigger concerns. Taken together, the rate peak, the series of cuts, and the Fed’s cautious tone all echo the environment of 2008, showing that today’s scenario has strong parallels to that earlier crisis period.

This chart shows the relationship between the Fed’s interest rate policy and the S&P 500.
Before the 2008 crisis, when the Fed began cutting rates, investors shifted capital from bonds to stocks, helping the S&P 500 climb to its peak.
The same pattern is visible now as well. The anticipation of rate cuts from FED already supported the S&P 500 in reaching new highs. The stock market cheered the first rate cut in 2025, but it will be more happy if FED makes further cuts in the future.
But this boost comes with risks. While lower rates fuel equity markets, they also reduce the attractiveness of government bonds by lowering yields.
If rates stay artificially low for too long, it weakens the government’s ability to roll over its massive debt through bond markets. That challenge, balancing growth stimulation with debt sustainability, is exactly what we’ll explore in the next section.
U.S. Bonds in Crisis Mode — The Silent Risk Nobody Talks About!

This chart shows how the 10-Year U.S. Treasury yield moved around the 2008 financial crisis and what it meant for bond investors.
Most beginners should know this point. Bond prices and yields always move in opposite directions. When yields rise, it means bond prices are falling, which is not profitable for investors holding old bonds. When yields fall, bond prices rise, creating gains for existing bondholders.
For example, you buy a 10-year U.S. Treasury bond with a face value of $1,000 that pays a 5% coupon. That means you receive $50 every year in interest.
Now, suppose market interest rates fall from 5% to 3%. New bonds being issued only pay $30 per year (3% of $1,000). But your bond still pays $50 per year, which is much more attractive.
Because of this, investors are willing to pay more than $1,000 for your bond to lock in that higher income. The price of your bond might rise to around $1,200 so that the $50 coupon equals the new market yield of about 3–4%.
Now look at image 8 carefully, between 2003 and 2007, yields steadily increased as the Fed hiked rates. This made bonds less attractive, while investors chased higher returns in equities and real estate.
During the 2008 crisis, fear gripped the markets, and investors rushed into Treasuries as a safe haven. Heavy demand for government bonds pushed their prices up sharply, and as a result, yields collapsed from above 5% to below 3%. This flight to safety made bonds extremely profitable for those who were already holding them.
👉 In simple terms: before the crisis, bonds lost shine compared to stocks and housing. But during the crash, Treasuries became the safe harbour, their yields dropped, prices soared, and bondholders reaped big profits.

As explained in the previous paragraph, from 2003 to 2007, the Fed kept hiking rates, and the 10-Year Treasury yield climbed toward 5%, making bonds less attractive compared to booming stocks and real estate.
As cracks appeared in the economy, investors slowly returned to Treasuries, causing yields to peak and then begin falling. When the 2008 crisis hit, demand for Treasuries exploded, yields collapsed from around 5% to 2%, creating big profits for bondholders.
Fast forward to today, and the same pattern is taking shape. In 2022 and 2023, the Fed hiked aggressively to combat inflation, sending the 10-Year yield to levels not seen in more than a decade. Yields remained elevated through 2024, much like they did before the 2008 crash.
But now, in 2025, yields have begun drifting downward again as investors seek the safety of Treasuries and the Fed shifts toward rate cuts. The resemblance to early 2008 is hard to ignore — high yields at the end of a tightening cycle, followed by a sharp move lower as confidence in the economy starts to erode.
In short, the 10-Year yield curve is flashing the same signals it did before the last major crisis. Falling yields may look positive for bond investors, but history reminds us they often signal a deeper problem that capital is fleeing risk assets and bracing for turbulence.
But here’s the critical difference, the U.S. fiscal backdrop is far weaker now than in 2008. Public debt has exploded. In 2008, total federal debt was about $10 trillion, roughly 65% of GDP. Today in 2025, federal debt is around $37–38 trillion, more than 120% of GDP (CBO & Treasury data).
The cost of servicing this debt has ballooned too: annual interest payments are now over $1 trillion, larger than the U.S. defence budget, and projected to be the fastest-growing line item in the federal budget.
But here’s the bigger question: who will keep funding this debt?
In 2008, the U.S. could count on strong foreign demand for Treasuries. Japan, China, and European central banks were reliable buyers, treating U.S. bonds as the ultimate safe haven.
Today, that cushion looks weaker. Japan, once the largest foreign holder, has already been reducing its Treasury exposure to defend its own currency. China has been steadily diversifying away from the dollar, trimming its holdings while increasing gold reserves.
Even European central banks and Middle Eastern sovereign wealth funds are allocating more toward commodities and non-USD assets. At the same time, global gold purchases by central banks are at record highs, signalling a quiet but clear shift in where “safety” is being defined.
Gold could serve as a protective asset amid increasing U.S. market risks due to excessive debt - Ray Dalio, Famous Hedge Fund Manager and Policy Maker
This means U.S. Treasuries may not enjoy the unquestioned demand they had in 2008 — a structural change that makes today’s bond crisis far more dangerous.
This matters because it changes the psychology of investors. In 2008, U.S. Treasuries were unquestionably the safest asset in the world, the debt load was manageable, inflation was low, and global investors trusted Washington’s fiscal position.
As a result, while yields are falling, the “flight to Treasuries” is less dominant than it was in 2008. Money is also flowing into gold, commodities, and even non-USD assets as investors hedge against U.S. fiscal risk.
⚠️ The Silent Risk
The 10-Year yield curve is again flashing crisis signals — but unlike in 2008, the U.S. bond market itself has become part of the problem. Falling yields might still hand short-term profits to bondholders, but structurally, the risks are greater: debt is heavier, interest costs are crushing, and safe-haven flows are being split with gold and alternative assets.
In other words, history may rhyme, but this time the rhyme is darker. The very asset that saved investors in 2008 — U.S. Treasuries — may not be able to play the same role in 2025.
The Takeaway: Bonds, Debt, and Your Future
Looking at these charts and numbers, the echoes of 2008 are unmistakable. But in 2025, the stakes are higher. U.S. federal debt has soared past 120% of GDP, interest costs alone exceed $1 trillion a year, and the bond market — once the world’s ultimate cushion — is no longer the unquestioned safe haven it was.
The U.S. national debt, now surpassing $37 trillion … Treasurys are no longer reliable safe-haven assets due to the growing risk of the U.S. government printing more money - Ray Dalio, Famous Hedge Fund manager, Investor and Policy Maker
This shifts the risk from being just a banking or private-sector crisis to potentially a sovereign debt confidence crisis.
Three lessons stand out:
Debt cannot expand forever without consequence. Private borrowers in 2008 taught us this lesson, and today the federal balance sheet is testing those limits.
Central banks can buy time, but not rewrite reality. Rate cuts may lift markets in the short run, but they cannot erase structural debt risks or restore trust once it is lost.
Resilience must be built before the storm. Investors, institutions, and governments that ignored warning signs in 2008 paid the heaviest price.
For policymakers, this is the moment to confront hard choices: rein in deficits, restore credibility in the bond market, and signal long-term discipline before markets force it. For investors, it is the moment to diversify beyond assumptions — to gold, commodities, cryptos, and geographies less tied to the U.S. debt cycle.
History doesn’t repeat, but it rhymes. In 2008, the storm came from Wall Street, and Treasuries were the refuge. In 2025, it may come from Washington’s own balance sheet.
👉 The past has given us the map. The present demands courage. The future will reward only those prepared.
Disclaimer: The views and opinions expressed in this article are for informational purposes only and do not constitute financial, investment, or legal advice. The article reflects the author’s personal analysis and may contain assumptions, predictions, and uncertainties that are not guaranteed. Before making any investment decisions, readers should conduct their own due diligence or consult a licensed financial advisor. Past performance is not indicative of future results. The publisher and author are not responsible for any losses or damages arising from actions taken based on this article.
About the Author:

Indrazith Shantharaj is an investor, trader, and author. He is known for making finance and stock market concepts simple and practical.
He has written more than 10 best-selling books that have helped thousands of readers understand money better and move closer to financial independence.
To learn more about his work, articles, and latest updates, feel free to visit:
Sources:
U.S. national (gross) debt was $10 trillion - https://www.investopedia.com/us-national-debt-by-year-7499291?utm_source=chatgpt.com
2025 Debt Projection - https://www.jec.senate.gov/public/vendor/_accounts/JEC-R/debt/Monthly%20Debt%20Update%20%28PDF%29.pdf?utm_source=chatgpt.com
Private Firm Leverage was high before 2008 and declined after - https://business.uoregon.edu/sites/default/files/2023-07/finance-23-p9-bellon-dobridge-gilje-whitten.pdf?utm_source=chatgpt.com
Government Assist for AIG - https://www.gao.gov/products/gao-24-107033?utm_source=chatgpt.com
US to take 10% equity stake in Intel - https://www.reuters.com/business/us-take-10-equity-stake-intel-trumps-latest-corporate-move-2025-08-22/
A 2023 facility providing term funding against high-quality collateral - https://www.federalreserve.gov/publications/files/13-3-report-btfp-20230316.pdf
2008 Fed Rate Cuts - https://www.federalreservehistory.org/essays/great-recession-of-200709?utm_source=chatgpt.com
Bankruptcy of Lehman Brothers - https://www.britannica.com/event/bankruptcy-of-Lehman-Brothers?utm_source=chatgpt.com
Fed lowers interest rates, signals more cuts ahead - https://www.reuters.com/business/fed-lowers-interest-rates-signals-more-cuts-ahead-miran-dissents-2025-09-17/?utm_source=chatgpt.com
Gross National Debt Reaches $37 Trillion - https://www.crfb.org/press-releases/gross-national-debt-reaches-37-trillion?utm_source=chatgpt.com


Mình có lần lướt đọc mấy trao đổi trên mạng شيخ روحاني thì thấy nhắc nên cũng tò mò mở ra xem thử cho biết. Mình không tìm hiểu sâu rauhane chỉ xem qua trong thời gian ngắn để quan sát bố cục s3udy cách sắp xếp các mục và trình bày nội dung tổng thể. Cảm giác là các phần được trình bày khá gọn, các mục rõ ràng nên đọc lướt cũng không bị rối Berlinintim, với mình như vậy là đủ để nắm tin cơ bản rồi. q8yat
The cricket player performance metrics on https://888starz-bd.org/ are some of the most comprehensive I’ve found this year. It’s easy to compare strike rates and bowling averages across different venues. The interface is clean and doesn't suffer from any noticeable lag on my mobile device.
hello
Finding time to write essays between shifts was tough, so I tried https://www.nursingpaper.com/our-services/nursing-essay-writing-service/. The essay I got was insightful and original, with strong arguments supported by credible sources. It genuinely sounded like my own writing, just more polished. I didn’t have to worry about plagiarism or formatting errors at all. If you’re a nursing student balancing work and studies, this service really helps lighten the load.