
How to Test an Options Trading Strategy Using Opstra Definedge Analytics?
- Profile Traders
- Jul 13, 2022
- 5 min read

Updated: Dec 30, 2023
As a trader, you know that options trading provides unique opportunities to profit. However, simply buying and selling options without a plan is risky and can lead to losses.
To succeed in options trading, you must develop strategies matching your risk tolerance and goals. Many different options trading strategies are available, so choosing the ones that fit your individual trading style is essential.
However, how do you foresee the results of an options trading strategy?
Content:

Call Options (CE) Buying Example:
Let's assume you are bullish on Reliance stock and aim to make some profits using options.
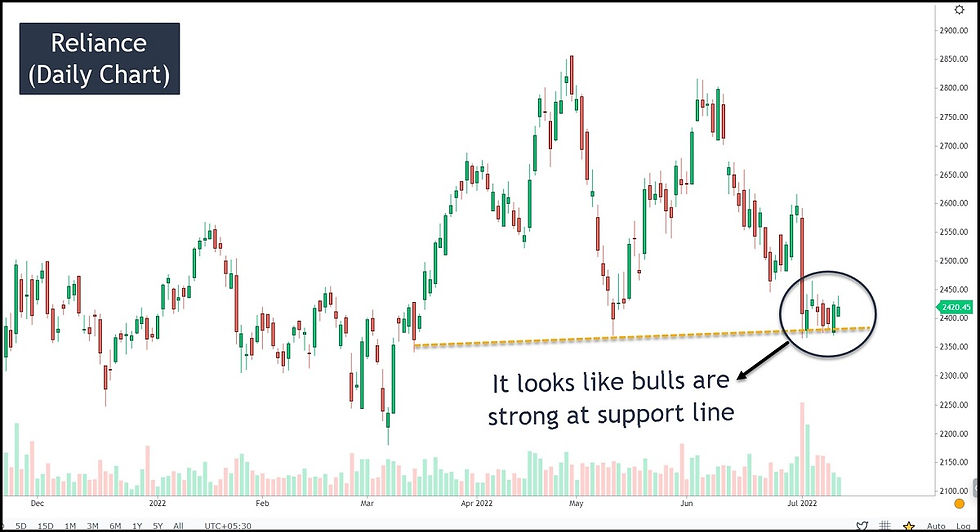
After looking at the daily chart, a trader turns bullish on the stock and decides to buy a 2600 call option (CE) to make money.
But to become a successful options trader, knowing the probability of success and how much profit (if the plan goes right) in advance is always a good idea.

The payoff chart from Opstra gives the below helpful information:
The probability of success is only 13.82%
The maximum loss is Rs.3,675
The maximum profit is unlimited (it depends on where the price closes on the expiry day)
The breakeven point occurs at 2615
Do you think this information helps to plan your options trades?

Put Options (PE) Selling Example:
Let's assume a trader is bullish on Titan stock and aims to make some profits using options.

A gap was sustained for 4 trading days in the daily chart of Titan. Hence, as per the breakaway gap theory, it is bullish.
Therefore, a trader is bullish on the stock and decides to sell a 2100 put option (PE) to make money (PE selling is also a long trade in options).
Again, knowing the probability of success and how much profit (if the plan goes right) in advance is a good idea.

The payoff chart from Opstra gives the below helpful information:
The probability of success is 68.24%
The maximum loss is unlimited (due to the naked selling of PE)
The maximum profit is Rs.14,194
The breakeven point occurs at 2063
This information certainly helps to plan your options trades.
What is Opstra Options Strategy Builder?
Opstra Options Strategy Builder or Opstra Options Analytics is a simple tool consisting of several tools that help to find, analyze, and track options trading opportunities.

Visit the Opstra Definedge home page and create an account to use the tools.
Then it will automatically route to the Strategy Builder page.

The strategy builder page provides different options:
Select the stock or index.
To select the expiry. It can be either this month or next month. For Nifty and Banknifty, weekly options are also available.
Select the strike price. Every option contract comes with different strike prices. So, a trader can pick a suitable strike price for his strategy.
Select the option type (CE or PE).
To select buy or sell. The combination of 4 & 5 decides whether a trader is taking a long or short trade.
Then opt for 'Add Position,' and the opstra strategy builder gives the payoff chart.

Let's take a little complicated options strategy, credit put spread strategy.
Credit Put Spread is a simple vertical spread designed to earn profits when a trader expects a moderate rise in the stock/index.
It involves the buy and sell of put options of the same security, with different strike prices with the same expiry date.

A day trader looks at a 30-minute chart of sun pharma and sees a long trade opportunity as the same previous resistance line is acting as support now.
Instead of buying CE or futures, he deploys a credit put spread strategy to take the benefits of time decay and cap the maximum loss scenario (like naked options selling).
So, he decided to sell 870 PE (main leg) and buy 850 PE (hedge leg).
He can see the payoff chart for this strategy in Opstra strategy builder.

Below are the critical observations from the payoff chart:
The success probability is 48%
The maximum profit potential is Rs.7,980
The maximum loss is Rs. 6,020
This will become a breakeven trade when the price reaches 859
The margin required is only Rs. 35,972 (as compared to the futures margin of Rs. 1,44,950).
This will give better clarity for a trader on whether to deploy the strategy in live trading or not.

What is the Pay-off Date in Opstra?
The pay-off date in Opstra is nothing but a profit or loss booking date for your options strategy.
By default, Opstra populates the next available expiry date as a 'pay-off' date. But traders can change this to any date based on their idea of the exit.

What is Net Credit in Opstra?
The net credit is the options premium amount available in your trading account when you sell options.

The above image shows Nifty 16700 CE has been sold, and the maximum profit is Rs.1,040.
If you observe the 'Net Credit' tab, it also shows Rs.1,040.
How to Perform Backtesting in Opstra?
Opstra provides a backtesting facility only for paid users (Rs.1,000 per month). So free users will not be able to conduct any backtesting in Opstra.

You can watch the below video to learn more about Opstra Definedge.
Opstra Options Chain Analysis
The option chain lists all the available calls and puts options contracts of an options instrument for various strike prices for the selected expiry period.
Click on the 'open interest' tab and click on 'Option Chain' to view it.

It lists all the options chain details. However, the free plan has some delays, and the paid users get the live data.
Another simple option is to click the 'Greeks' tab in the Strategy builder (as shown in the below image) to see the options greeks of the instruments in the selected strategy.

Clicking the 'Greeks' tab will show the below options greeks details.

Opstra Options Open Interest
Whenever a person takes a trade using an option contract, he will create a new position (opening) or liquidate an existing one (closing).
Hence, traders also note how many options contracts were 'opened' against 'closed' and use this information to develop their options strategies.
In simple words, open interest is the number of option contracts that exist for a particular stock or index.


Opstra Definedge vs. Sensibull - Which is Better?
Opstra provides free pay-off charts but charges Rs.1,000 to use other features.
Sensibul charges Rs.480 (lite) or Rs.640 (pro) monthly to use the features.
Sensibul is integrated with most stock brokers in India, whereas Opstra has no connection with brokers.
Traders can't place a trade through opstra, whereas they can place a trade directly to their broker account through sensibul.
Options Trading Course
Many traders fail to make money in options trading because they either buy a call option (CE) or a put option (PE) to make some quick money.
High probability of winning
Losing less money if the logic fails
A small to big profit if the logic gets success
Many Options Trading Strategies help to achieve the above goal in aligning with the trading ideas.
Dive in to know more!


Finding the best stock market institute in Jaipur can make a big difference in building practical market skills. It’s helpful to choose programs that focus on real-world strategies, risk management, and consistent learning rather than just theory.